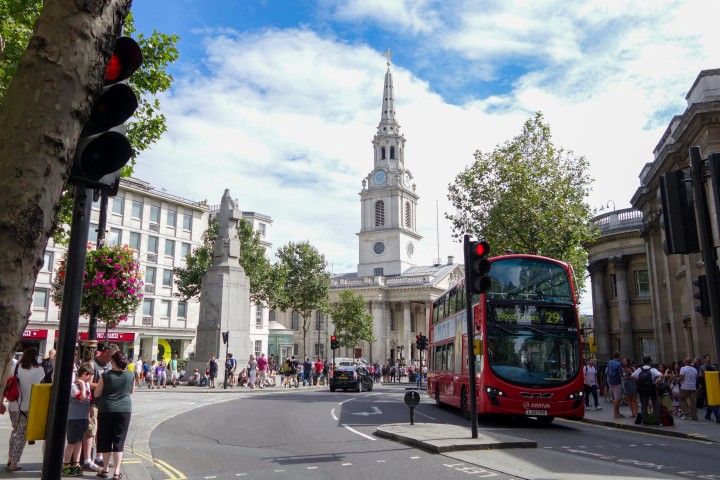
According to the latest figures from the Land Registry’s HPI Index, these are the top London boroughs for house price growth in 2017.
Comparing average property prices in January to those in September, we’ve worked out the percentage growth difference between these months.
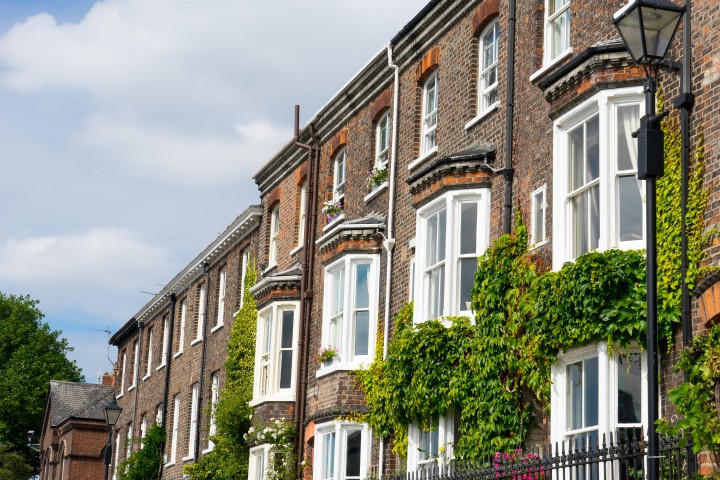
Coming out on top is Merton, where property prices have increased from January to September 2017 by an average of 6.7%. To put that into reality, that’s an average house price increase from £484,033 to £516,599.
The borough includes neighbourhoods like Morden and Collier’s Wood, where there has been increased demand for more affordable properties in these areas – which could be why average property prices have risen at this rate.
Close behind is the London Borough of Lewisham, with an average house price increase of 6.4%.
The recent figures also confirm that Kensington and Chelsea remains the most expensive borough in London – which is consistent with our last performance update in May – with an average house price of £1,203,181.
In contrast, the lowest average property price can be found in Barking and Dagenham at £284,375. That’s over four times less than in Kensington and Chelsea.
Scroll through to see the top London boroughs for house price growth in 2017.
Merton
Average price* - £516,599
Price growth in 2017** - 6.73%
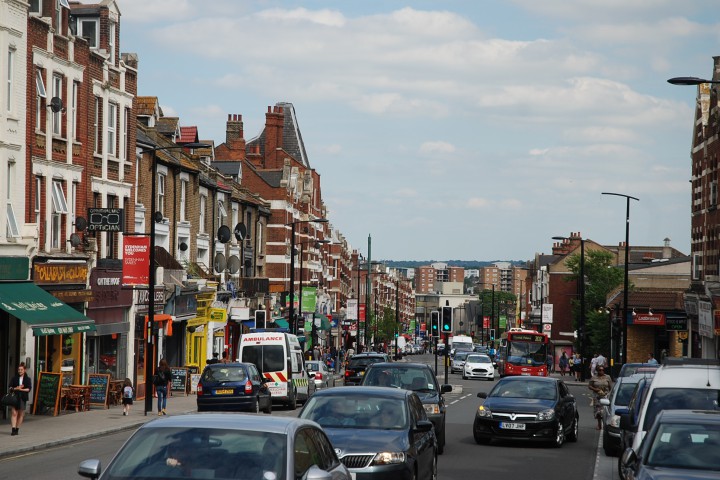
Lewisham
Average price - £426,145
Price growth in 2017 - 6.39%
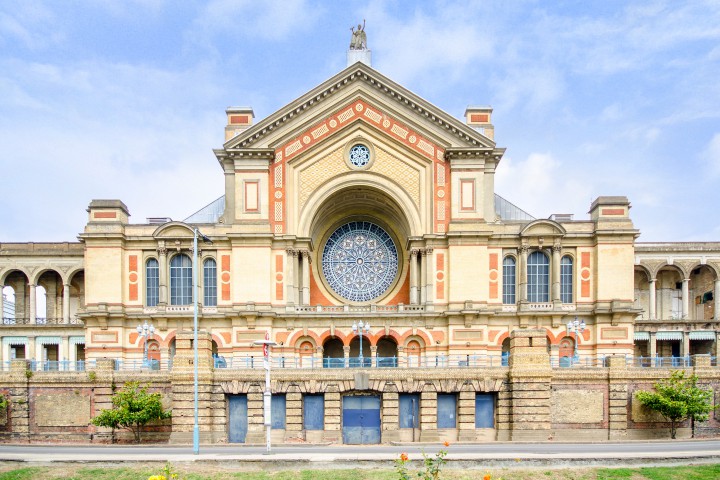
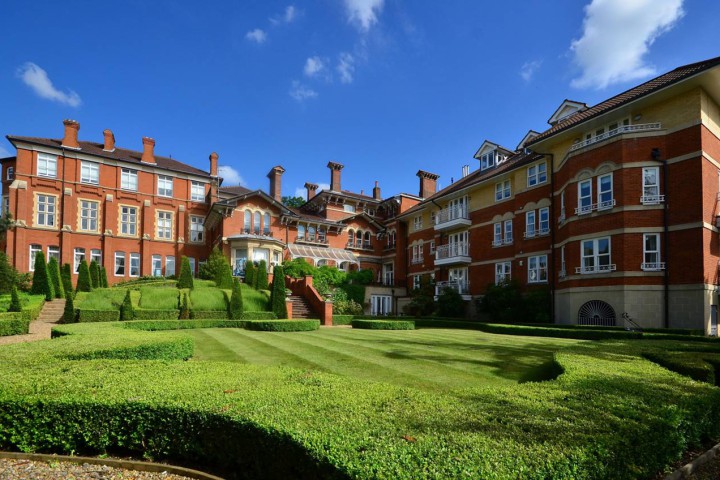
Haringey
Average price - £584,032
Price growth in 2017 - 6.02%
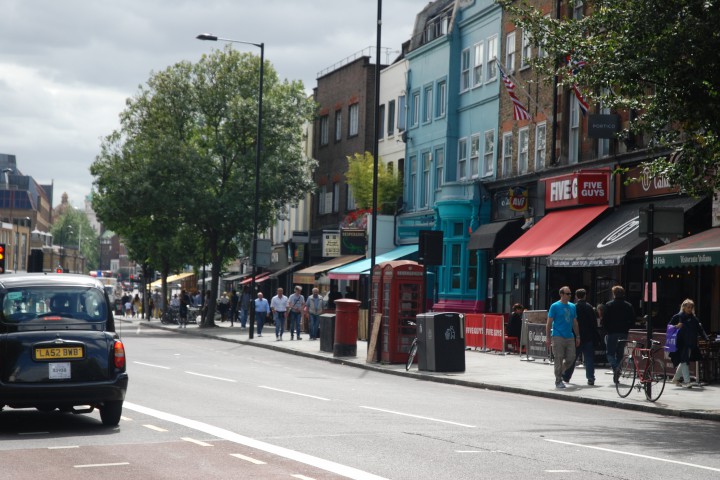
Islington
Average price - £676,428
Price growth in 2017 - 5.64%
Croydon
Average price - £382,845
Price growth in 2017 - 5.57%
*Average price in September 2017
**Percentage increase comparing average prices in January and September 2017